MacBook Neo Thermal Pad Mod and Analysis
Phoebe Conetits
Apr 20, 2026
Intro
Apple is allergic to the concept of cooling. This is true, has been true, and paradoxically will remain true even after the heat death of the universe. (Friend) Apple silicon SoCsSystems-on-a-chip are incredibly efficient, so you might expect that even with Apple's track record it'd be trivial to keep them cool.
Haha. Well. You see.
Even the MacBook Neo's A18 Pro designed for iPhone chassis and iPhone cooling is capable of warming from 30 °C90 °F to 100 °C210 °F within the first few seconds of a video transcoding job. Apple transitioned from the undersized heatsinks of the Intel era to no heatsinks whatsoever in the Apple silicon era. The A18 Pro is packaged under an IHS,Integrated heatspreader and a thin layer of thermal compound plopped on top lets it dump heat into the graphene heatspreader that covers the logic board. This heatspreader does not make contact with the chassis' bottom panel; Apple leaves an air gap about 1 mm thick between the two to ensure the panel doesn't get too hot.
But aluminium is a very good conductor of heat, and 1 mm isn't that big of a gap, so by sandwiching a thermal pad between the logic board's heatspreader and the panel, the A18 Pro can conduct heat through the pad and into the panel. The panel's high surface area and direct exposure to the surrounding environment lets it act as a radiator for the SoC.
Sure enough, it works! Users who have performed this modification regularly report achieving higher scores in Geekbench 6. (Xerticle 2026) It can be taken further by replacing the graphene heatspreader with copper heatpipes and adding external cooling, (ETA PRIME 2026) but I do not wish to void my warranty just yet.
Why Leave Performance on the Table?
Comment sections and the orange website types seem to generally agree that the Neo's abysmal cooling, mostly solvable with cheap thermal pads and twenty minutes of arts and crafts, is actually a nefarious scheme by Apple to artificially limit the Neo's performance by causing it to thermal throttle immediately doing serious work like rendering videos so users step up to a MacBook Air. Market segmentation in other words.
This is a ridiculous conspiracy-brained thing to claim. If Apple had designed the Neo with adequate cooling, then they would have already done the same with the Air because the Air's cooling is bad for the exact same reason: it, too, has a graphene heatspreader over its logic board and an air gap between it and its chassis' bottom panel. The Air can benefit substantially from the exact same cooling mods as the Neo and with them can potentially outperform an equivalent MacBook Pro, (SPACE DESIGN WAREHOUSE 2025) unique among Apple's laptop offerings for having a fucking heatsink.
The M4 Air's four extra cores let it massively outperform the Neo in multithreaded workloads, and its higher boost clocks give it a small lead in singlethreaded workloads. (Burek 2026) I know I said it's sacrilegious to compare the Neo to its more expensive brethren in performance benchmarks, but that's because the results are all foregone conclusions. A Neo with a cooling mod doesn't even come close to closing the gap in multithreaded workloads, but it may be able to in singlethreaded workloads as if any reasonable person was going to spend twice as much money in the first place for not even 10% better web browsing performance.
The air gap and consequently the Neo's poor cooling performance are safety features. Thermal pads contacting both the A18 Pro and the Neo's bottom panel can conduct enough heat into the panel to make it dangerously hot. I initiated simultaneous stress tests on the E cores, P cores, and GPU in the monitoring software Stats (exelban 2026) and measured the temperature using a pre-Covid IR thermometer in a 21 °C70 °F basement. After 20 minutes, the hottest point on the bottom panel reached 43 °C.109 °F After 30 minutes, it surpassed 45 °C.115 °F This is dangerous—IEC 62368-1 standards limit this panel to 48 °C,118 °F but even that temperature is capable of causing burns over a few hours. (Mezin 2021) The Neo would surely get hotter faster if this were repeated in a warmer environment, for example outdoors during the summer, and it would become capable of causing burns in much less time.
My observations suggest that heavy loads on both the CPU and GPU are necessary because the chassis temperature seemed to remain below 40 °C100 °F with only the CPU stress tests running. 3D games seem to be the perfect real-world candidates to get the chassis nice and toasty, and given the Neo's education focus, little Timmy could plausibly give himself serious burns during a Roblox all-nighter on his school computer, and then Timmy's parents could plausibly sue Apple and the school district. Apple's decision to let the Neo overheat was correct, though the more correct decision would be to have designed the Neo so it doesn't need to throttle in the first place.
Test Setup and Benchmark Script
Four benchmarks were conducted under different conditions: the stock Neo sitting on a table, the stock Neo sitting on a desk fan, the modified Neo with thermal pads sitting on a table, and the modified Neo with thermal pads sitting on a desk fan. Photos of the fan and of the thermal pads applied to the Neo's logic board are shown below. Two additional thermal pads were applied to the flash chip and a graphene heatspreader covering electronics that I believe are related to the power supply and battery management.
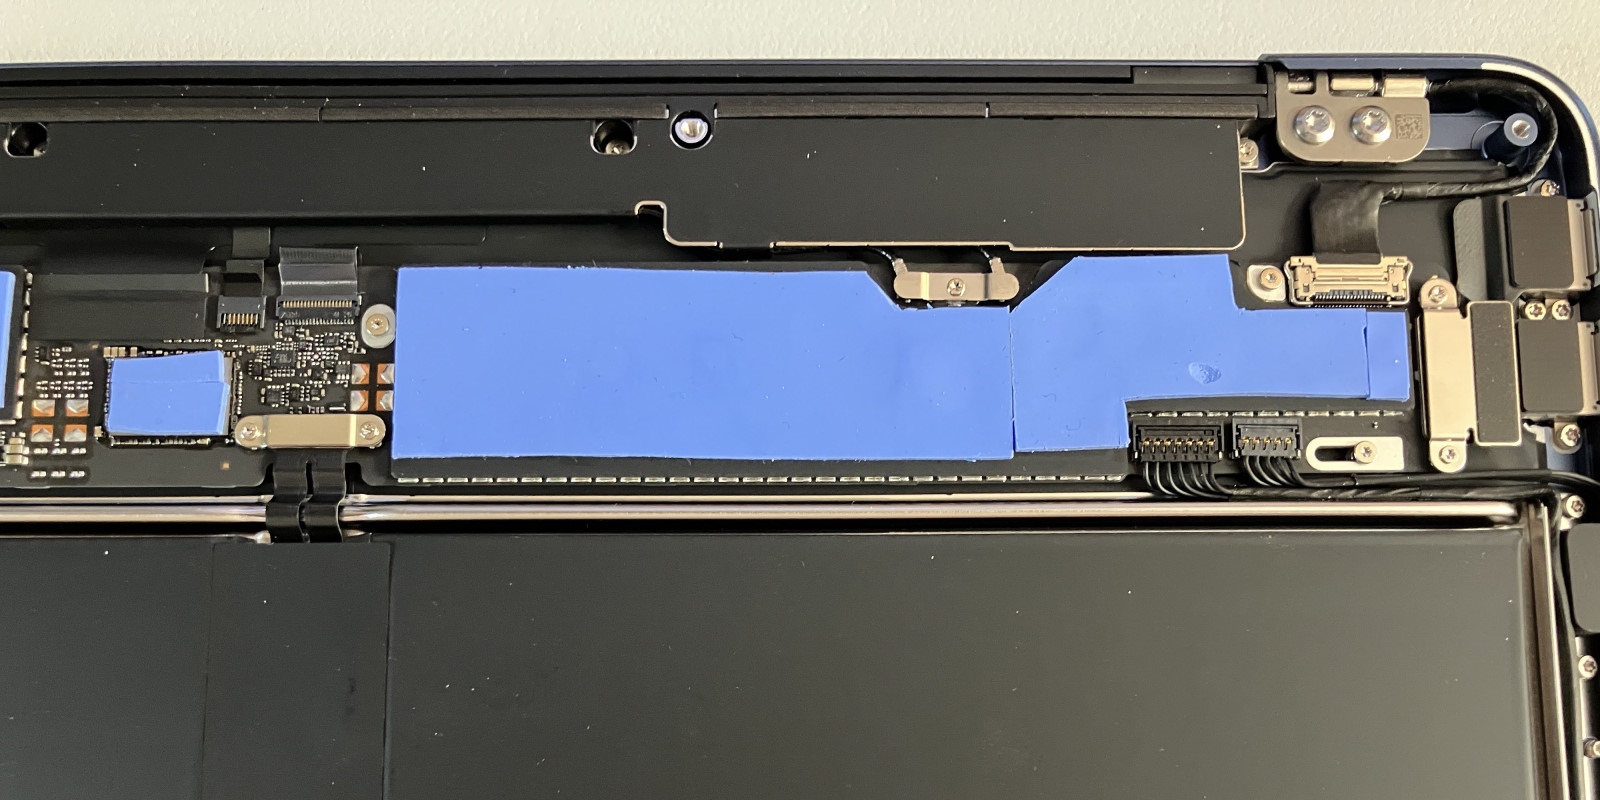
The thermal pads were chosen because I had them on hand. They were included with generic M.2 SSD adapters I purchased previously that included complimentary heatsinks I never used. The pads are 1 mm thick—forum users have indicated that 1.5 mm-thick pads offer superior performance because the bottom panel applies greater pressure to them when the Neo is reassembled. I could probably improve my Neo's performance further by buying thicker or higher-quality thermal pads, but the modification as it stands has provided enough data to analyze how the Neo behaves when thermal throttling.
All software other than built-in macOS software, Dropbox, and Stats was closed before beginning benchmarks; Dropbox and Stats run at login and I forgot they were open. The screensaver and automatic screen shutoff were disabled. The display was arbitrarily kept at brightness level 6 out of 16 the entire time to consistently contribute to total system power consumption and energy usage.
Each benchmark consisted of five consecutive runs of FFmpeg version N-123623-g238df21a4f using the command ffmpeg -i input/ffmpeg.mkv -threads 6 -c:v libx264 -preset slow -crf 18 -c:a copy -progress pipe:3 output/$whichCondition/ffmpeg$whichRun.mp4 3> logs/$whichCondition/ffmpeg$whichRun.log &. Note that only the video was transcoded and the audio was copied as-is. The source file was a copy of a short film extracted from a retail DVD and stored in a Matroshka container. This file contains 6374 frames encoded using the MPEG-2 codec at 720 × 480 29.97 FPS.
FFmpeg was configured to output its state to a log file every half-second during benchmarks. This log file does not contain precise timestamps, but it does contain the instantaneous framerate of the transcoder at the current frame of the output video. Framerate was logged every half-second or so, but the particular frames logged were inconsistent between two runs. These framerates were linearly interpolated, and the integral was computed to determine the total frametime of each FFmpeg run and allow comparison between different FFmpeg runs. Note that the number of frames as seen in Figures 7 through 10 in the Results and Discussion section is much less than 6374. This is because FFmpeg changed the framerate of the output to 23.98 FPS, and I did not notice until nearly finished with the writeup long after collecting all data and modifying the Neo.
Macmon (vladkens 2026) was used to log system monitors. Macmon logs various temperature, power consumption, and frequency parameters and the time at which they were recorded. The inclusion of timestamps allows accurate estimates of energy usage and required CPU cycles by integrating power consumption and CPU frequency, respectively, with respect to time. Macmon began logging data 5 seconds before the first FFmpeg run began in each benchmark to gather baseline readings and analyze system heating behavior, and it continued logging data for 120 seconds after the final FFmpeg run concluded to analyze system cooling behavior.
Results and Discussion: Temperature and Power
The Neo was slowest and ran hottest in its stock configuration with no additional cooling provided by a fan. The Neo in its stock configuration while cooled by a fan was faster, but insignificantly so—only 1.4% on average. The addition of thermal pads resulted in an average 8.4% reduction in time needed to transcode five videos compared to stock, and thermal pads alongside active cooling provided by a fan resulted in a 9.6% decrease. In all four test conditions, the first FFmpeg run was the fastest of the five, and subsequent runs converged to a consistent maximum time. The P core frequency under load was found to be heavily dependent on the CPU temperature—hence the performance increases due to cooling alone—whereas the E core frequency under load was temperature-independent. The four E cores ran at essentially their maximum boost clock of 2.42 GHz the entire time as shown in Figure 1.
-
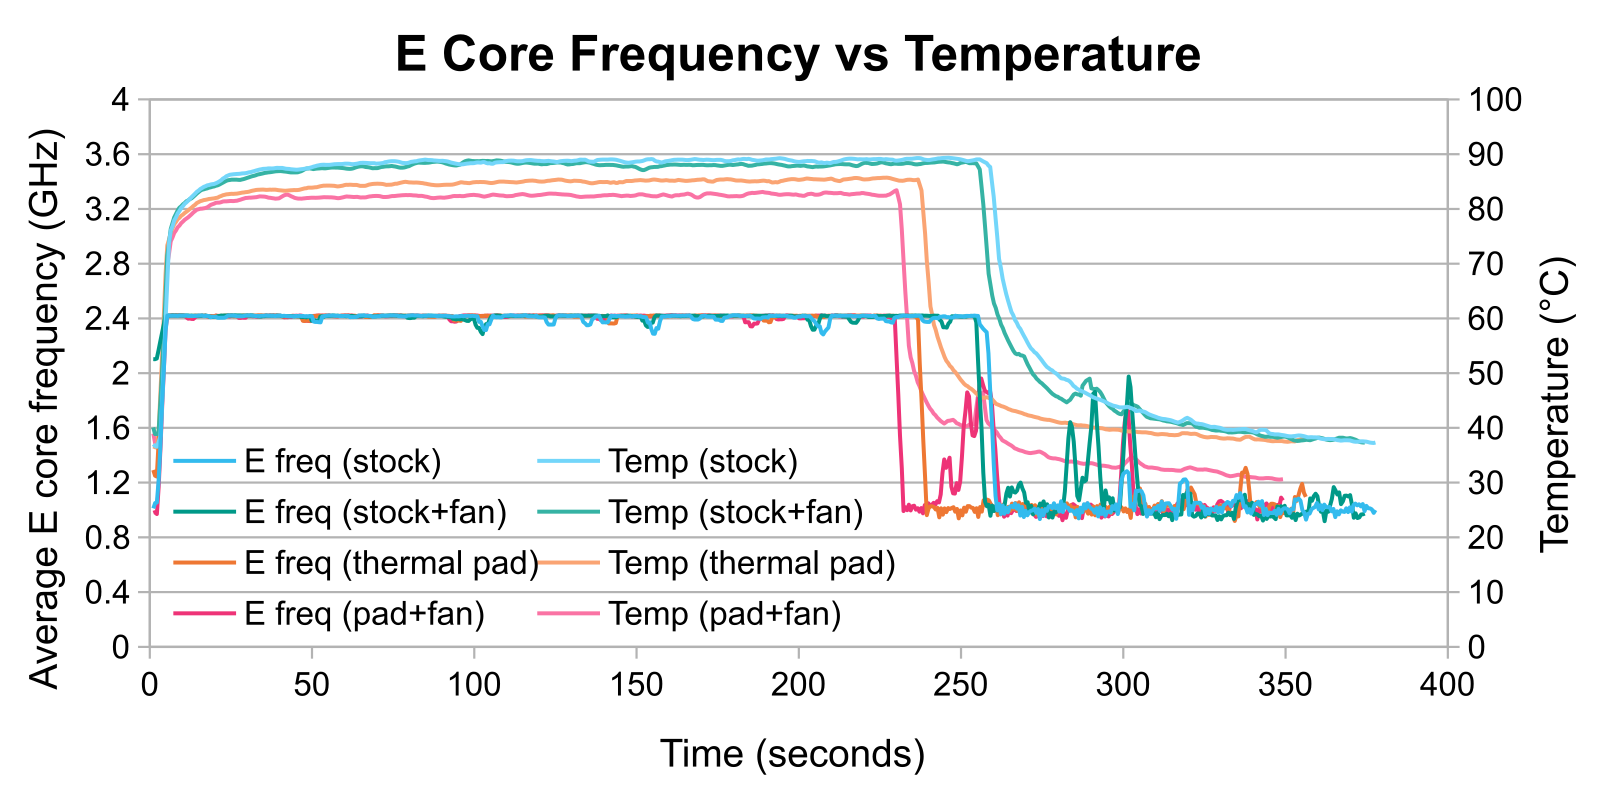
Figure 1. The average E core frequency during all four benchmark conditions as a function of time plotted alongside the CPU temperature. The graph has been smoothed by taking the moving average of the sample data. Each value at time t = x is the average of five consecutive values at f(x - 2), f(x - 1), f(x), f(x + 1), and f(x + 2). -
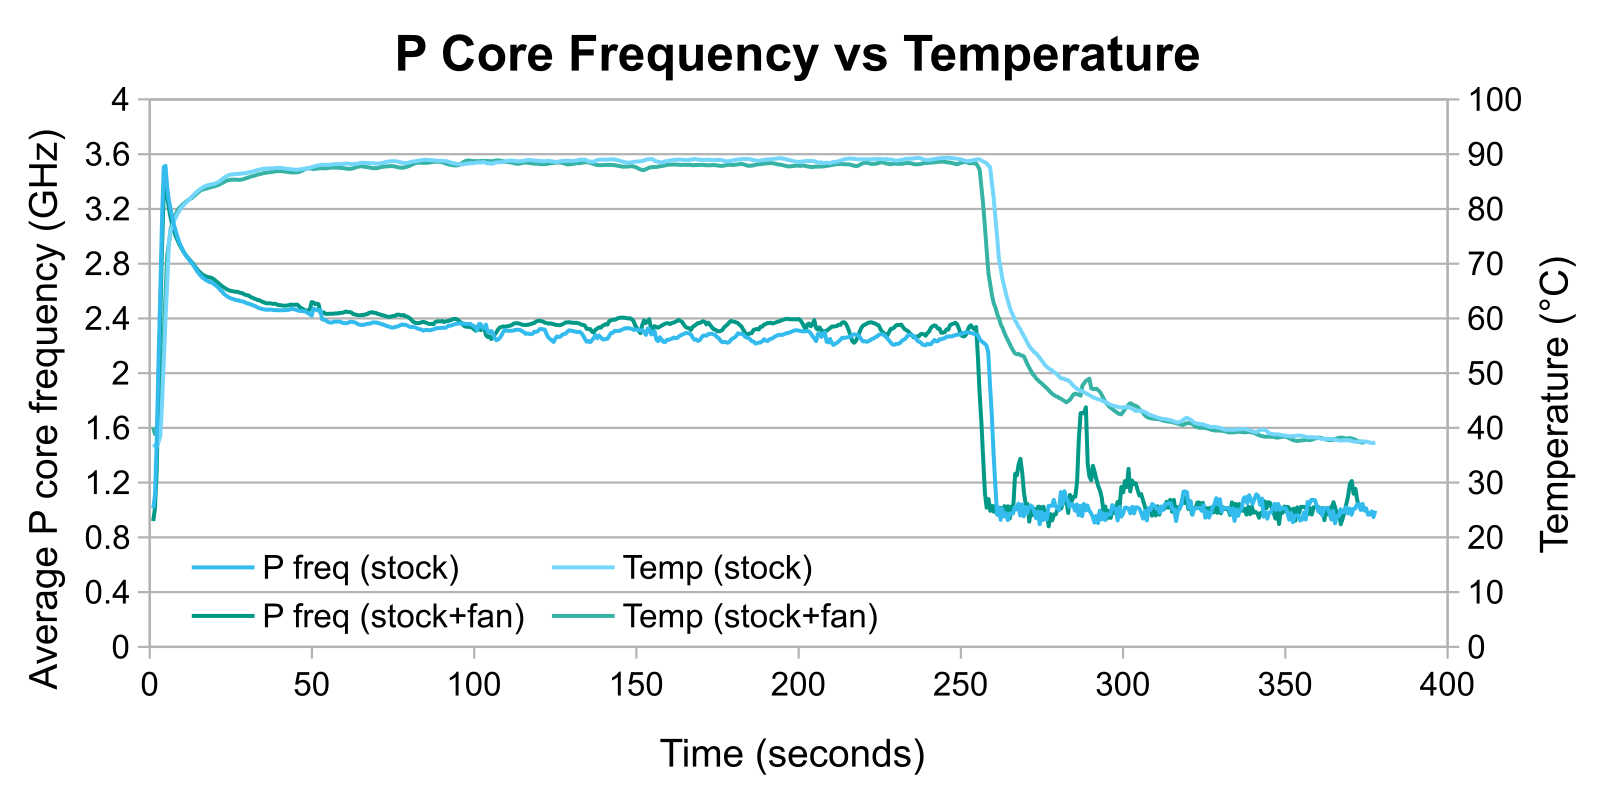
Figure 2. The average P core frequency as a function of time plotted against temperature for just the two benchmark conditions featuring the stock Neo. The graph has been smoothed by taking the moving average of the sample data.
P core behavior of the stock Neo with and without a fan will be discussed in detail first. Figure 2 shows a plot of average P core frequencyi.e., the average frequency of the two P cores at the moment the sample was logged and average CPU temperature as a function of time similar to Figure 1.
The P cores achieved a somewhat higher frequency when the stock Neo was cooled by a fan, averaging 2.42 GHz versus 2.36 GHz, respectively, during all five FFmpeg runs. The P cores appear to take a little longer to thermal throttle with a fan providing active cooling. Towards the end of the fifth FFmpeg run, they had a boost clock of about 2.32 GHz averaged over the final ten samples whereas the P cores during the fanless benchmark averaged 2.20 GHz.
The result is unsurprising. The Neo has no vents for airflow, and the SoC can only dump its heat into the bottom panel by heating the air around it, so a fan can only cool the SoC indirectly and not particularly well. This is illustrated by Figure 3 in which the post-benchmark cooling rate was essentially identical with and without active cooling. While the fan did initially cool the Neo vaguely faster, the final cooling rates were the same; the small activity spike that caused a temperature increase at about 40 seconds seen in the temperature plot should not have impacted this rate.
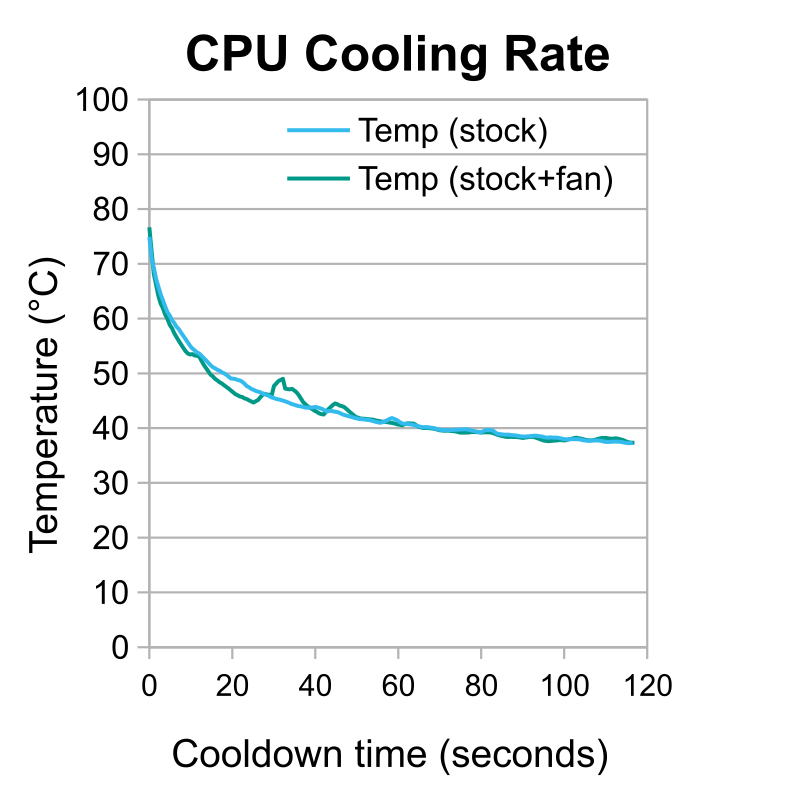
However, the fan does provide a good deal of airflow, so any heat that does make it to the bottom panel gets removed much faster, which likely explains the 120 MHz advantage after several minutes under load. It's not immeasurable, but in practice the transcoding speedup is nominal.
On the other hand, adding thermal pads does significantly improve the Neo's cooling capabilities and transcoding performance. They simultaneously kept the CPU at a lower temperature than stock—about 5 °C10 °F when comparing the passively-cooled benchmarks—and allowed it to draw more power—about a full watt cooled passively—as shown in Figure 4. The additional power consumption can be attributed to higher boost clocks sustained by the P cores as shown in Figure 5.
-
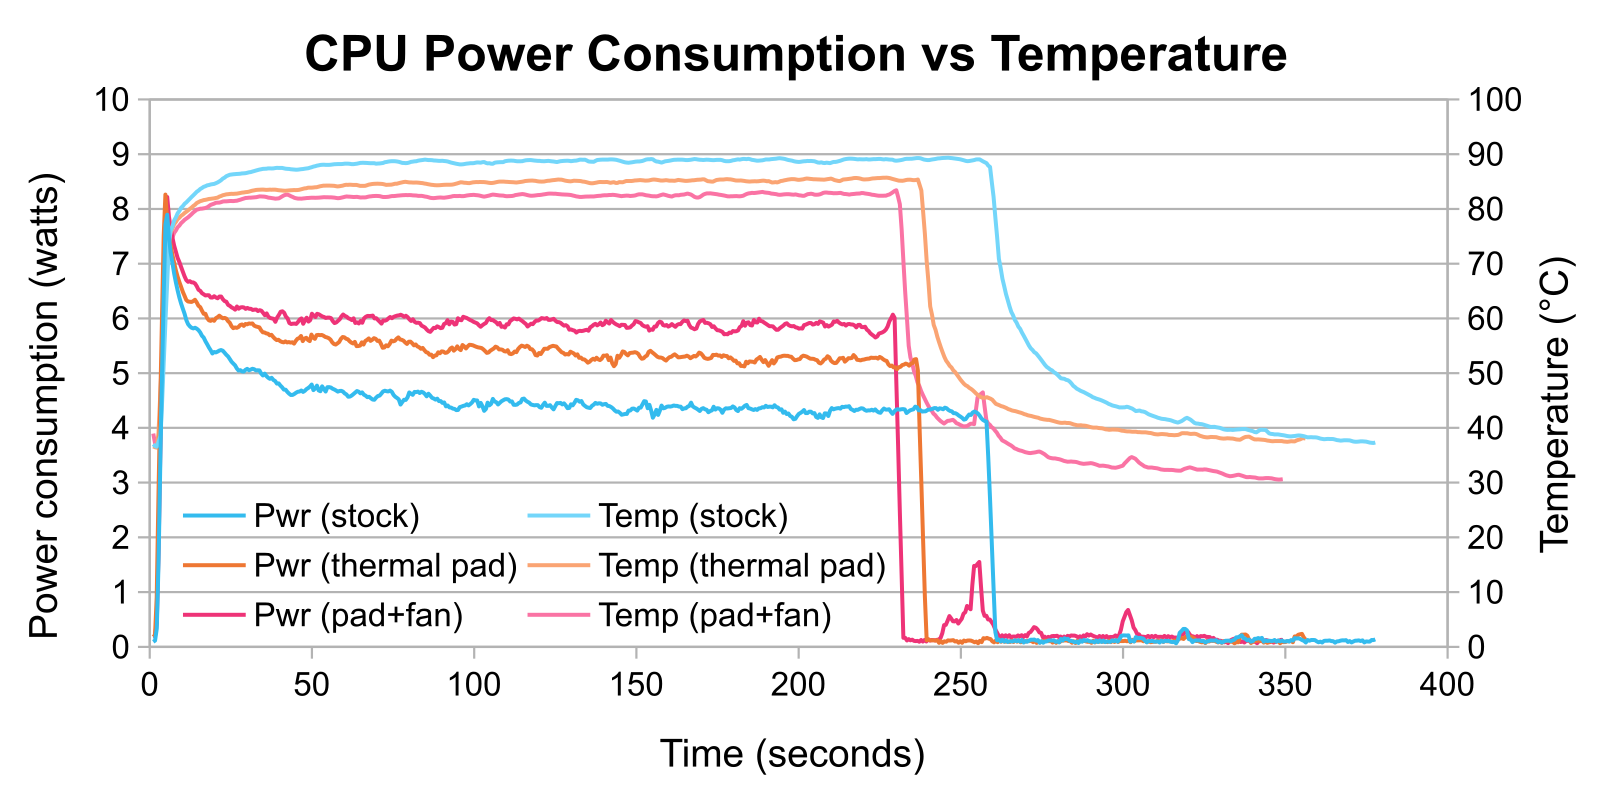
Figure 4. CPU power consumption as a function of time plotted against its temperature. The graph has been smoothed by taking the moving average of the sample data. -
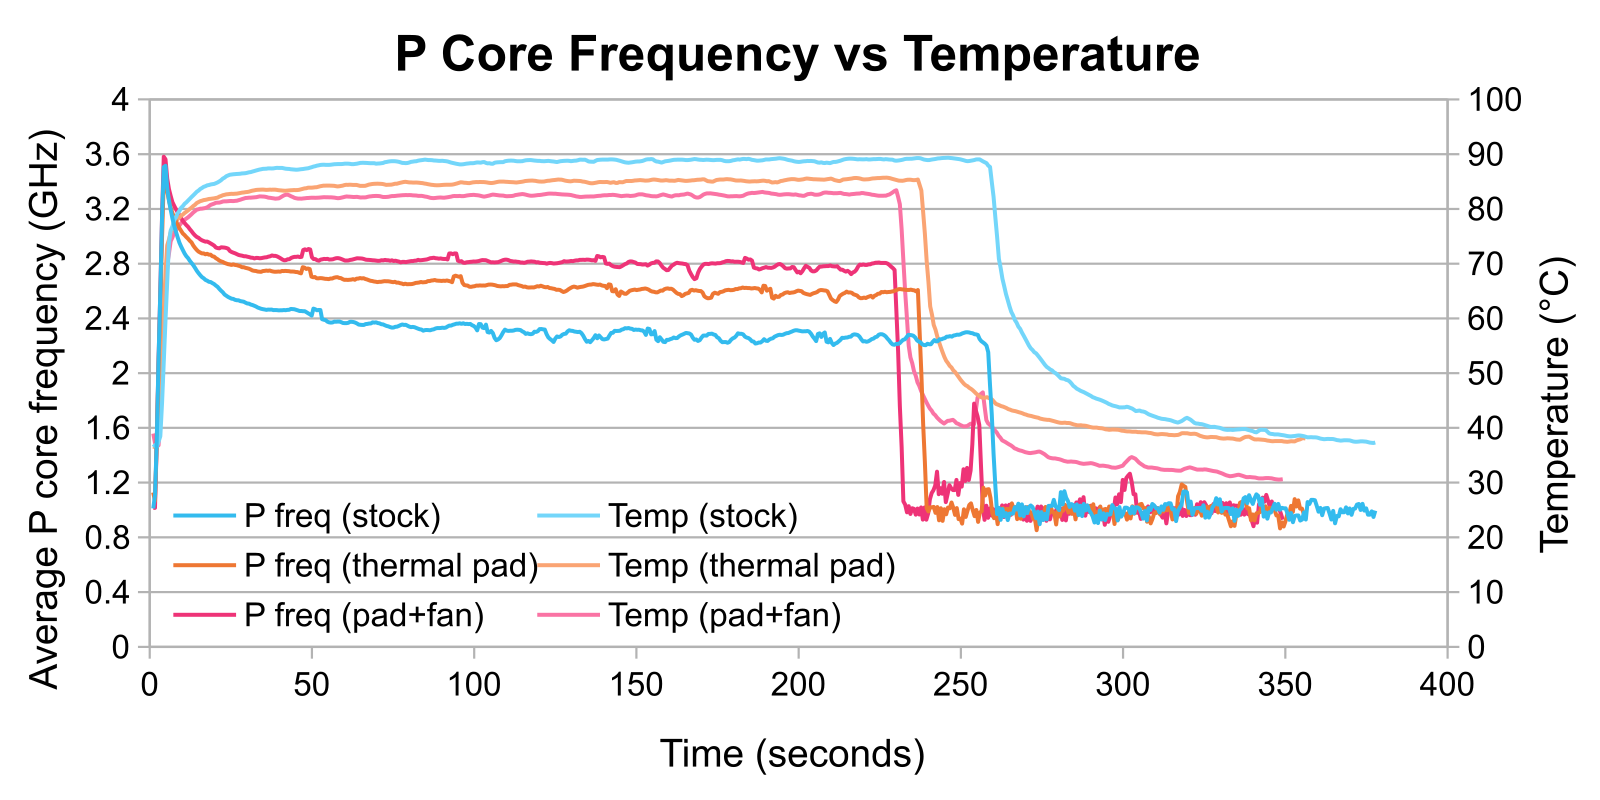
Figure 5. The average P core frequency as a function of time plotted against temperature for all conditions except the actively-cooled stock condition. The graph has been smoothed by taking the moving average of the sample data.
Once hot, the P cores settled on an average frequency of 2.61 GHz—more than 400 MHz faster than stock! Adding a fan pushed the frequency an additional 170 MHz to 2.78 GHz. The frequency increase provided by the fan was both absolutely and relatively greater than the increase that the fan provided to the stock Neo. The thermal pads improve cooling capabilities and by extension performance in all conditions. Figure 6 plots cooling rates at the end of the benchmarks like Figure 3.
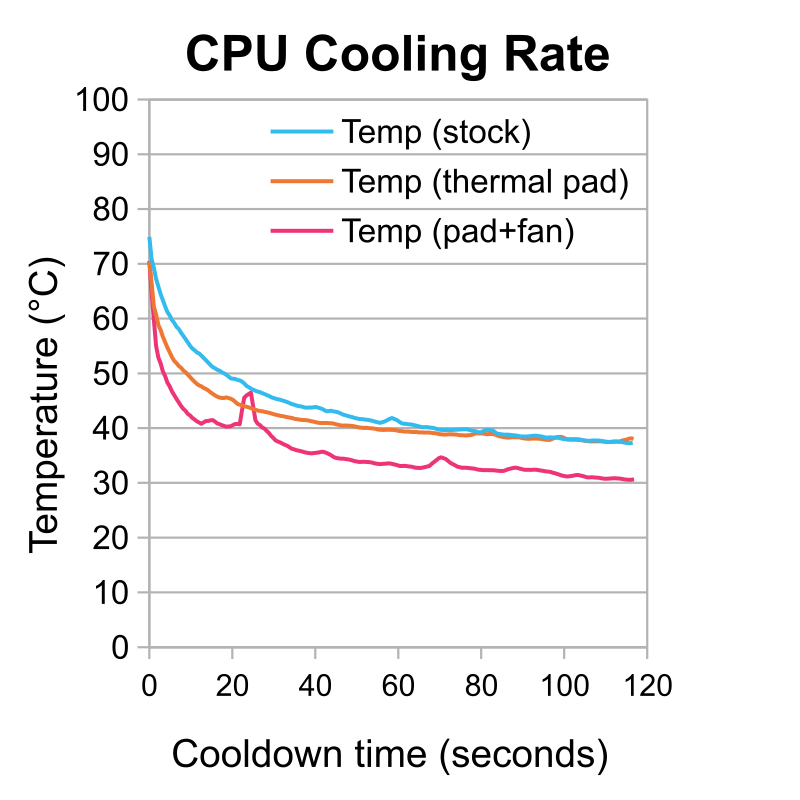
Post-benchmark, the CPU cooled off much faster with thermal pads applied due to a combination of a faster cooling rate and starting at a lower maximum temperature. However, the CPU converged to the same temperature at the end of the cooldown period regardless of the presence of thermal pads when passively-cooled. Active cooling was able to cool the CPU an additional 7 °C compared to either passively-cooled condition, letting it idle at about 10 °C above room temperature.
Results and Discussion: FFmpeg Performance
FFmpeg performance correlated with metrics like CPU frequency and temperature as expected. The output framerate of FFmpeg was logged for all runs under all conditions, and plots stacking the second through fifth runs relative to the first run were created. Figures 7 and 8 show these for the passively-cooled stock Neo and passively-cooled Neo with thermal pads, respectively.
-
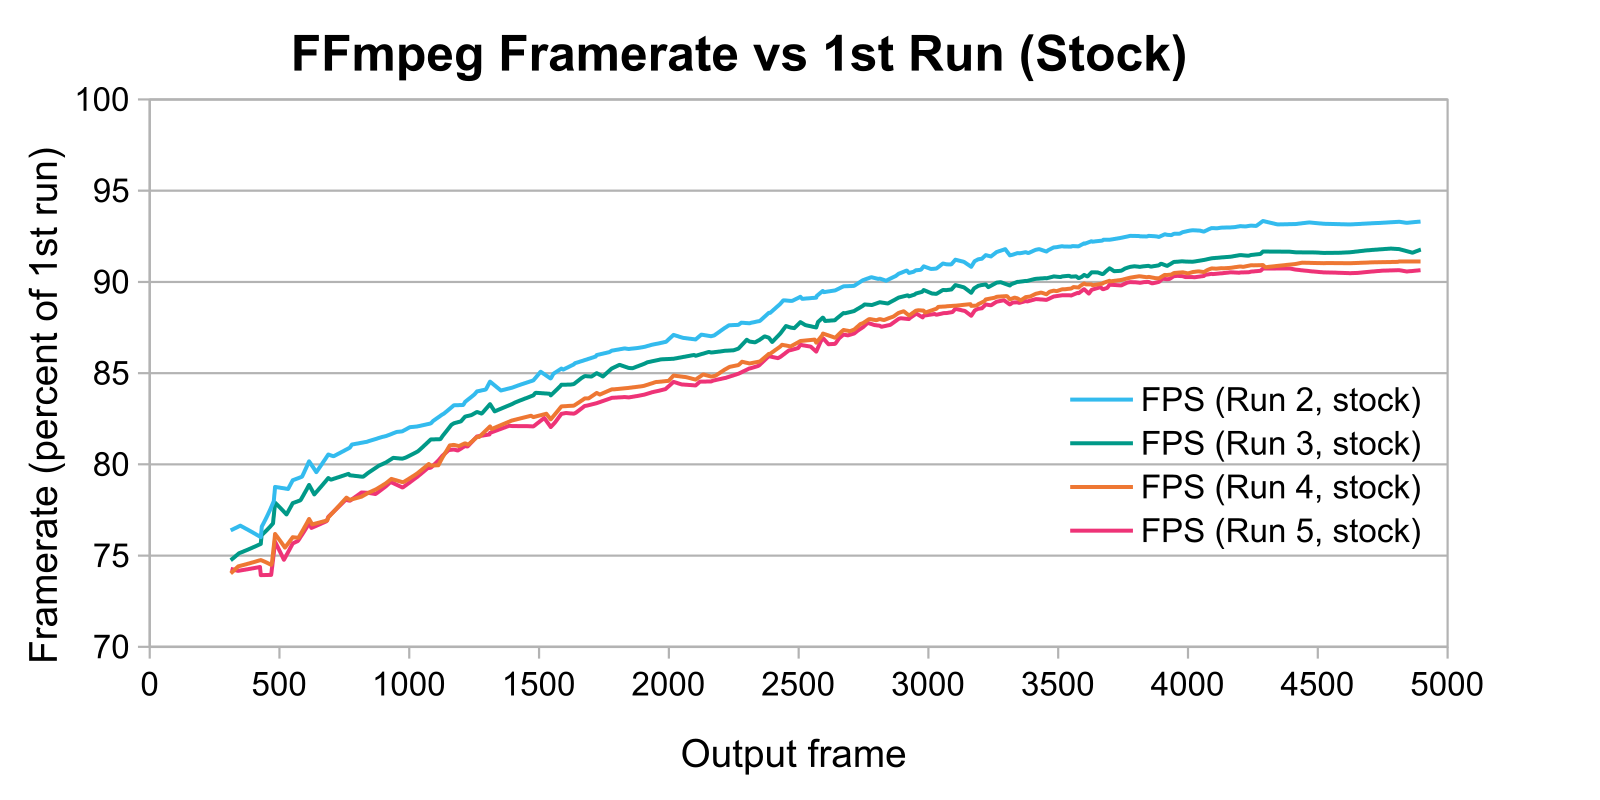
Figure 7. The instantaneous FFmpeg output framerate as a function of output frame relative to the first run of the stock Neo. -
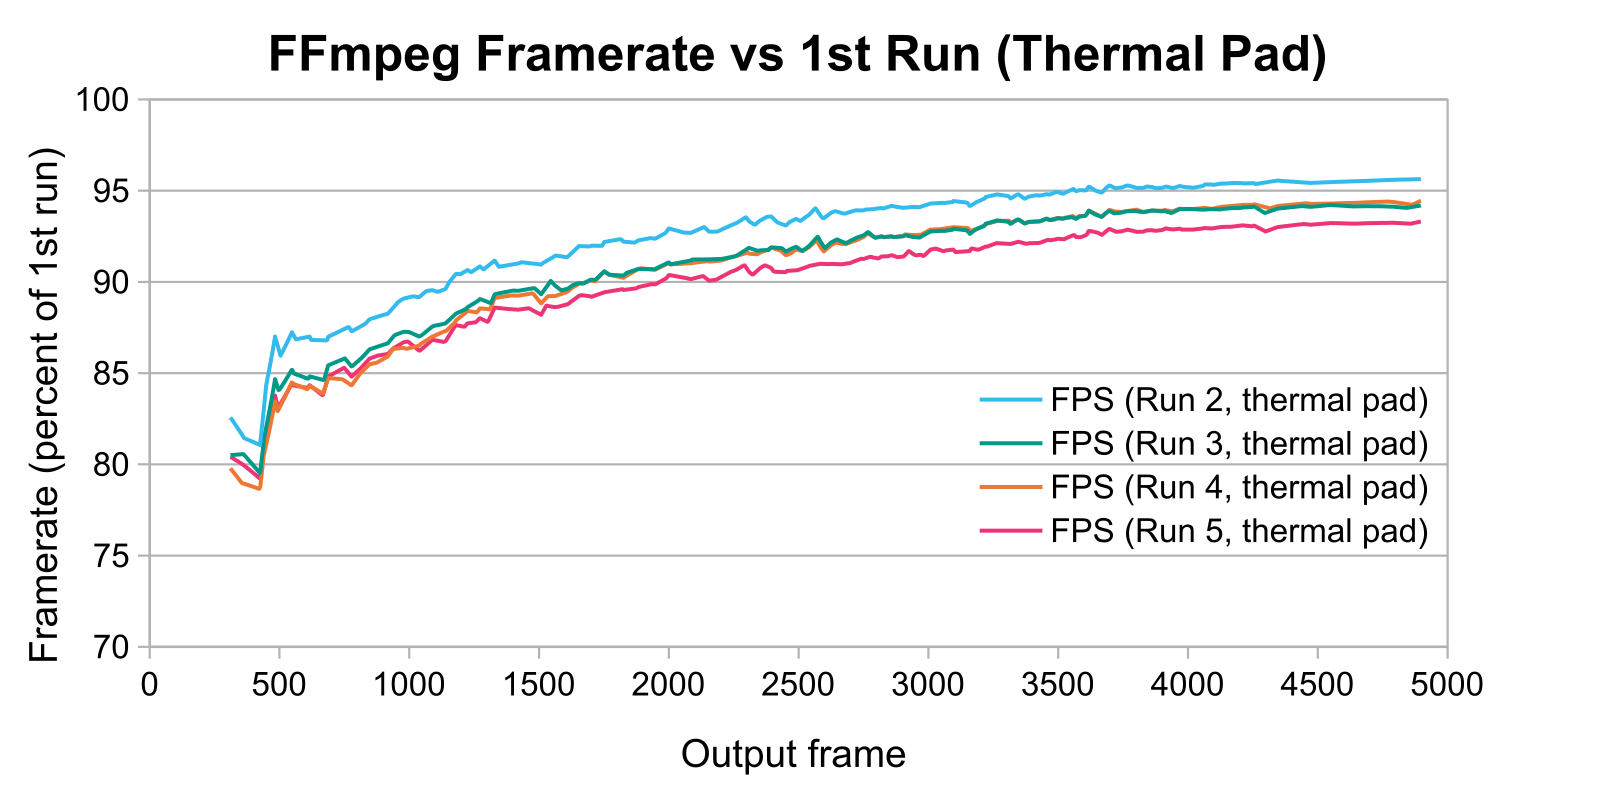
Figure 8. The instantaneous FFmpeg output framerate as a function of output frame relative to the first run of the modified Neo.
The logarithmic shape of the graphs in Figures 7 and 8 is explained by the nature of the first run: the CPU started the run while cool and reached its maximum temperature by the end, so the P core frequency decreased during the run. All subsequent runs began with the CPU preheated, so the P core frequencies were lower and approximately constant. The lower frequencies reuslted in decreased transcoding performance.
The thermal pads prevented the CPU from getting as hot, so the framerate of FFmpeg decreased slower and converged on a higher value in Figure 8 when compared to Figure 7. The four runs shown in Figure 8 both began and ended about five percentage points higher relative to their respective first run than the four runs shown in Figure 7. The thermal pad simultaneously improved the CPU's peak performance and reduced the decrease in relative performance over time due to thermal throttling.
Figures 9 and 10 plot the FFmpeg performance of all four conditions, but only the second and fifth runs, respectively, relative to each condition's first run.
-
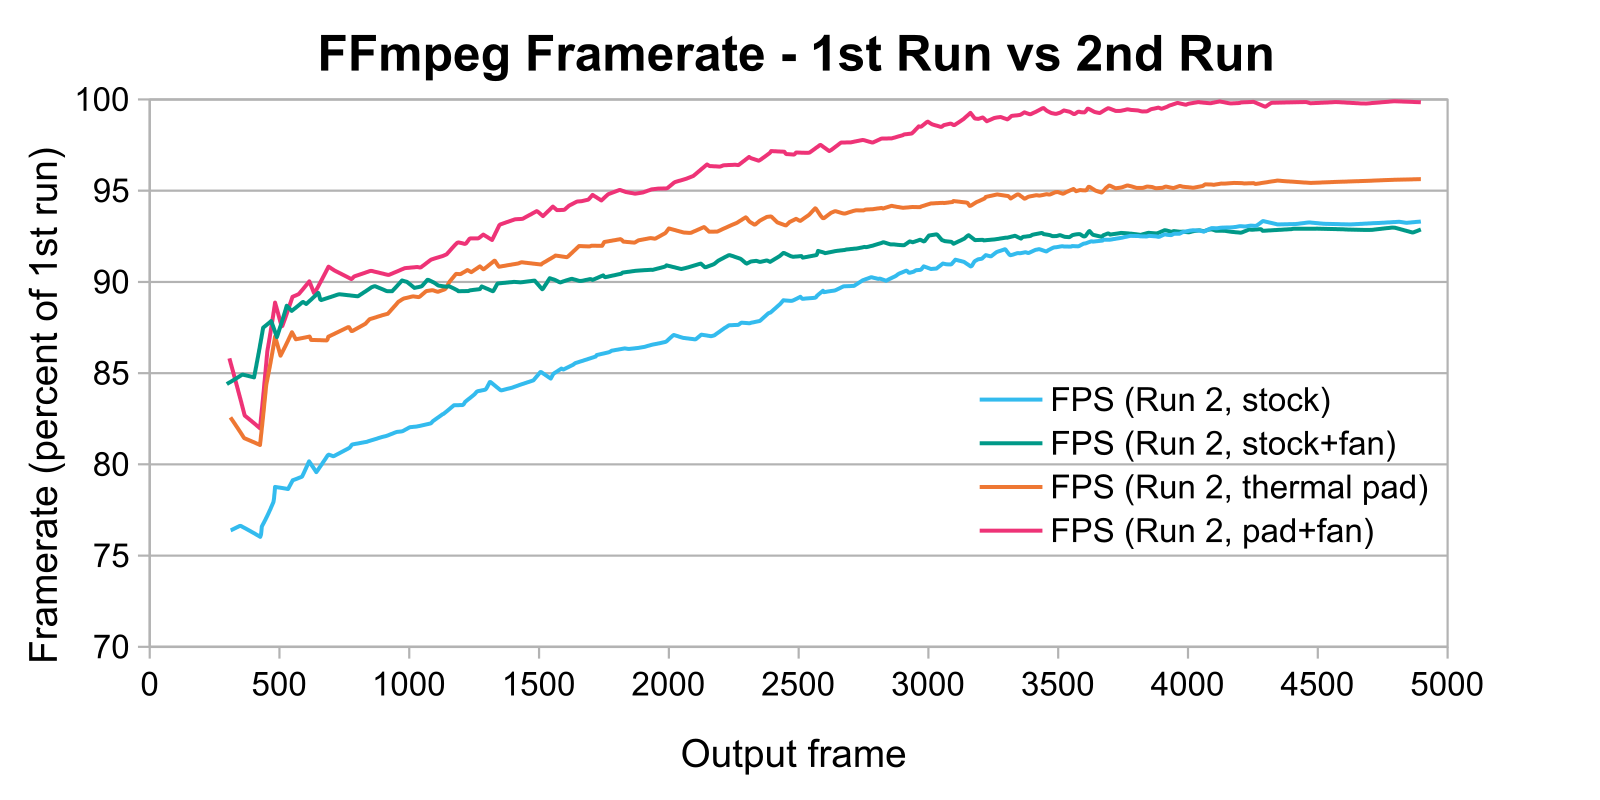
Figure 9. The instantaneous FFmpeg output framerate as a function of output frame for the second run of all four conditions. -
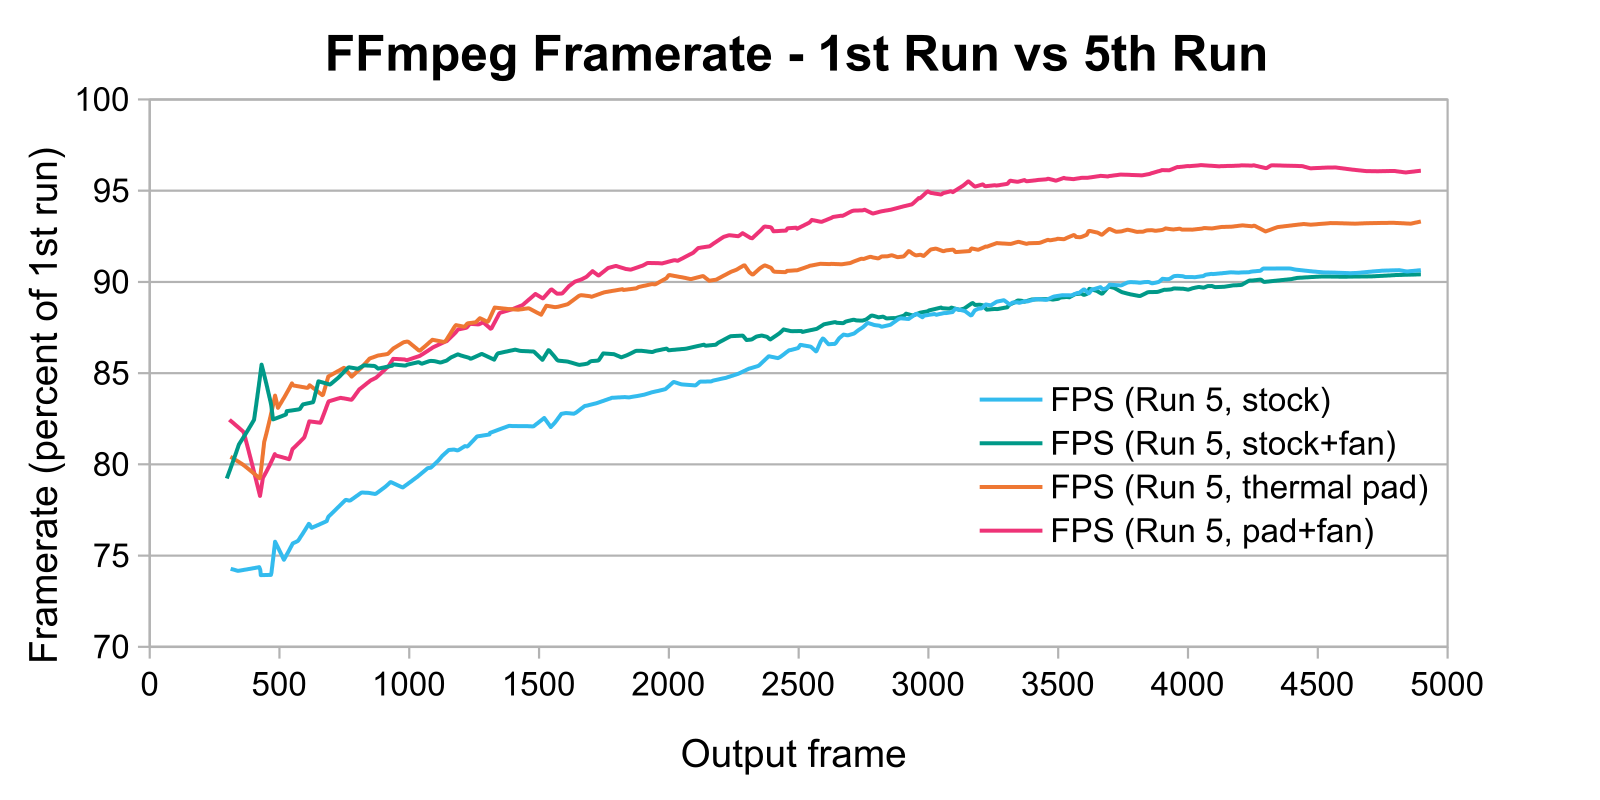
Figure 10. The instantaneous FFmpeg output framerate as a function of output frame for the fifth run of all four conditions.
The thermal pads alone caused the Neo to heat soak less quickly. The relative performance of the fifth passive thermal pad run was at least as high as the relative performance of the second stock run. The stock Neo converged to the same relative performance regardless of whether it had a fan providing active cooling. The modified Neo, however, did not slow as much over time when actively cooled; under this condition, the Neo was uniquely able to reach nearly 100% the performance of the first run during the last quarter of the second run. This is consistent with the P core frequency behavior as plotted in Figures 2 and 4, respectively.
Despite the performance increase, the modified Neo is nearly as efficient as the stock Neo. The total energy usage is shown in Figure 11 and the total CPU cycles that occurred during the benchmark are shown in Figure 12.
-
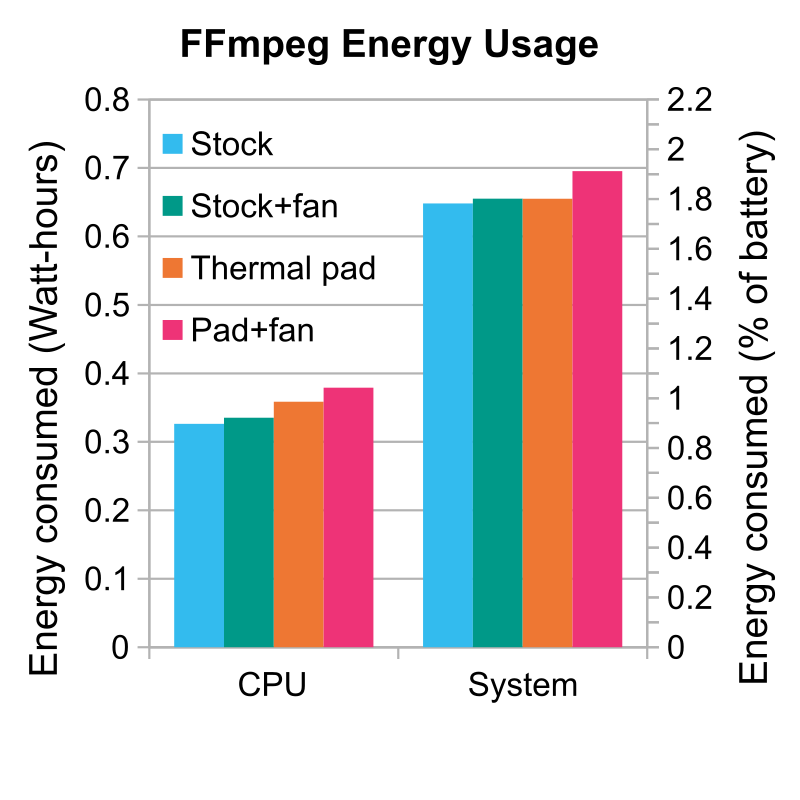
Figure 11. CPU and total system energy usage for all four benchmark conditions during FFmpeg runs only. Predicted battery usage is given by the right-side y-axis. -
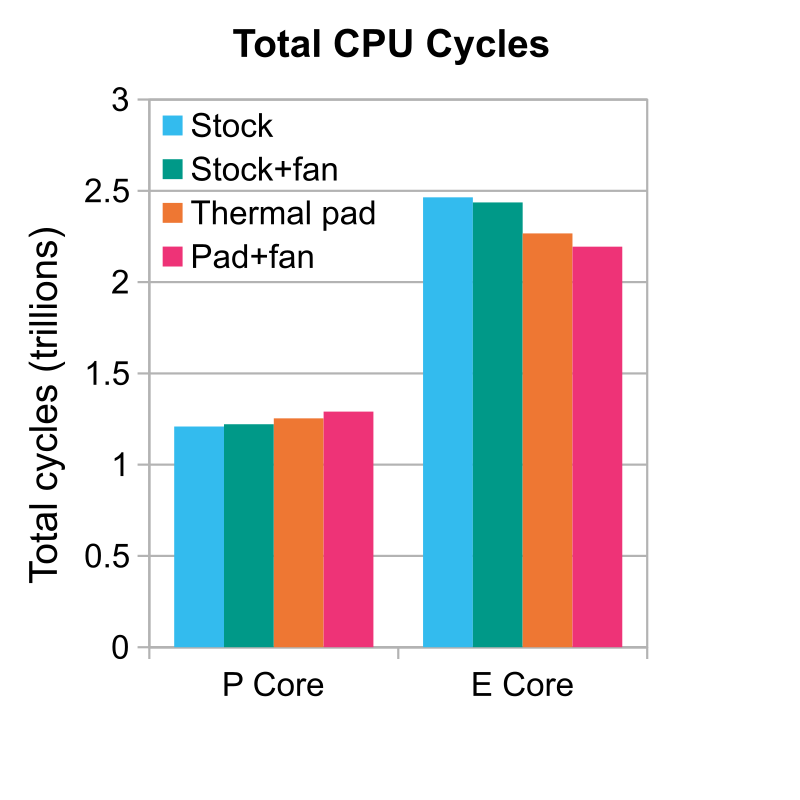
Figure 12. The total number of CPU cycles that occurred for each type of core in aggregate during all four benchmark conditions during FFmpeg runs only.
The CPU when passively cooled used about 10% more energy when equipped with a thermal pad versus stock. This is unsurprising; Figure 4 already indicates this. However, the system in its entirety only consumed about 1% more energy. The decreased runtime caused other components in the system, particularly the screen, to consume less energy while idling waiting for FFmpeg to run, and this decrease offset the CPU's increased energy usage. A plot of CPU and system power consumption as a function of time is shown in Figure 13.
Figure 12 suggests that the P cores contributed to energy usage much more than the E cores. The thermal pad increased the total number of P core cycles by less than 4%, and the reduction in runtime reduced the number of E core cycles by about 8%; remember, as shown in Figure 1, the E cores operate at peak boost clock essentially all the time. Microprocessor power consumption scales linearly with frequency and quadratically with voltage, so if the voltage-frequency curve of the Neo's P cores is approximately linear in the region between 2.2 GHz and 2.8 GHz, a cubic increase in power consumption of about 12% is predicted, and the observed increase in energy usage is reasonably consistent with this. Power consumption is discussed in much greater detail in Appendix C.
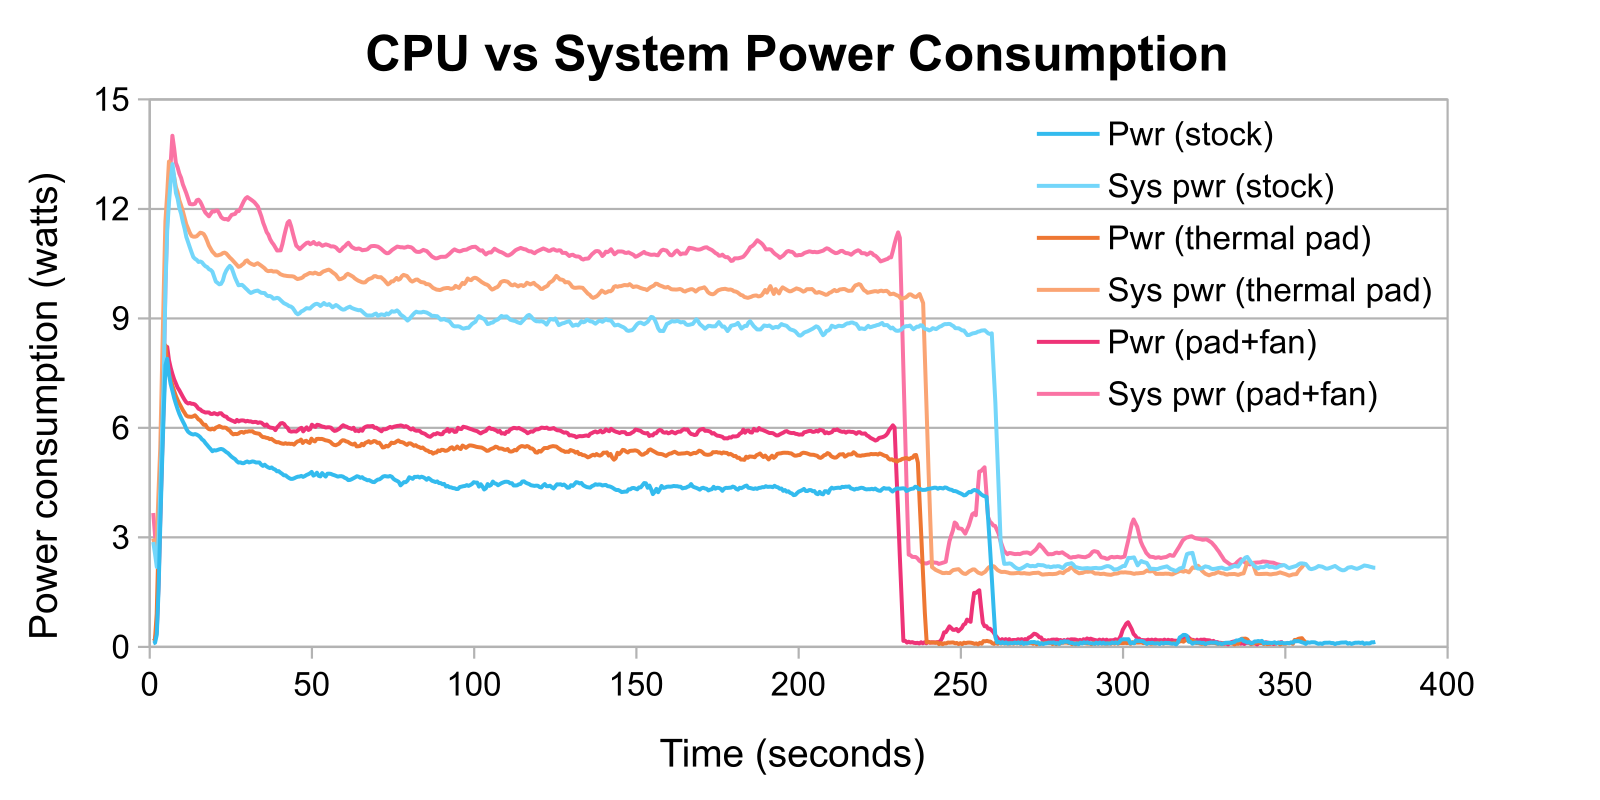
The Neo was less efficient when actively cooled with thermal pads. The performance increase did not significantly decrease the transcoding time compared to the passively-cooled thermal pad condition, but the CPU ran at a higher frequency and drew more power. There may be an issue with the data, however, because the increase in total system power consumption seen in Figure 13 was higher than the increase in CPU power consumption only for the actively-cooled modified Neo. Regardless, the increase in energy usage was small at only 6%, so if real it's insignificant in the real world.
Conclusion and Long-Term Concerns
Adding a thermal pad to a MacBook Neo unlocks a free upgrade by improving cooling and allowing the CPU to sustain higher boost frequencies. The main downside is that the Neo becomes capable of causing burns. A small tradeoff in the pursuit of performance.
There are two system components that are cause for concern. First, the battery. The battery tray contains a metal beam between the battery and logic board in both the Neo and MacBook Air, and I've seen it proposed that this is a barrier meant to block the warm air trapped above the logic board from heating the battery. I do not know if this is actually what it's for, though. The thermal pad mod bypasses this barrier and allows heat from the SoC to heat the region of the panel above the battery; the part closest to the SoC reached about 40 °C in the stress test. The battery itself doesn't make physical contact with this panel, so there still is an air gap and the SoC can't heat it directly, but it can heat the air around the battery and impede its cooling. This is exacerbated by the fact that the battery will run hotter while discharging faster as it must while the SoC is under heavier loads and heating the panel more.
Second, the flash. NAND flash does not particularly like operating at high temperatures, and it degrades faster while hot. This is generally a concern for long-term storage of a powered-off SSD, but as I understand it, this corruption can occur in a powered-on SSD if the host system doesn't periodically scrub it in order to detect errors. I suspect that the NAND will be fine, however. The region of the bottom panel directly above the NAND chip remained below 40 °C during the stress test, and that's comparable to idle commodity SSDs. Thus, since the SoC doesn't appear to significantly heat the NAND, the thermal pads may actually prove beneficial because I placed one on the flash chip so it can also use the panel as a heatsink.
Importantly, the Neo doesn't get hot while doing nothing in particular. Web browsing, word processing, and media streaming don't stress the system enough for the panel to become noticeably warm, and the average temperature of the SoC itself is often below the safe chassis temperature threshold according to IEC 62368-1, meaning it's outright impossible for the Neo to cause burns in these circumstances. The thermal pad mod seems to neither help nor hurt outside of the rare sustained heavy workload. This is probably for the best because it means 99% of the time the system behaves exactly the same as it did stock, but it does fare a bit better when performance is needed. Additionally, for any warranty work, the modification is completely reversible and there shouldn't be any signs it was ever done.
Appendix A: Timing
A few different timing methods could have been used to calculate FFmpeg performance. I opted to calculate frametimes from output framerate because it will be usable in all future work, but this was a backup method. I initially relied on file metadata to determine when the output MP4 files were created and last modified. By sheer luck, this method would have been acceptable for the scope of this writeup, but the metadata is too volatile to be trustworthy in general. Other benchmarks that I ran but omitted from this writeup featured videos that took negative time to transcode according to this method, which is obviously nonsense. Still, precisely none of my conclusions about trends and system behavior changed as a result of changing the timing method.
The P core frequency can also be used to estimate timing, and it appears to be accurate to the nearest Macmon sample. There are small dips in the P core frequency every 45 seconds or so in Figures 2 and 5. This isn't a coincidence: the P core frequencies momentarily drop in between FFmpeg runs. These drops appear as local extrema in the plot of the derivative of P core frequency with respect to time, which is shown in Figure 14.
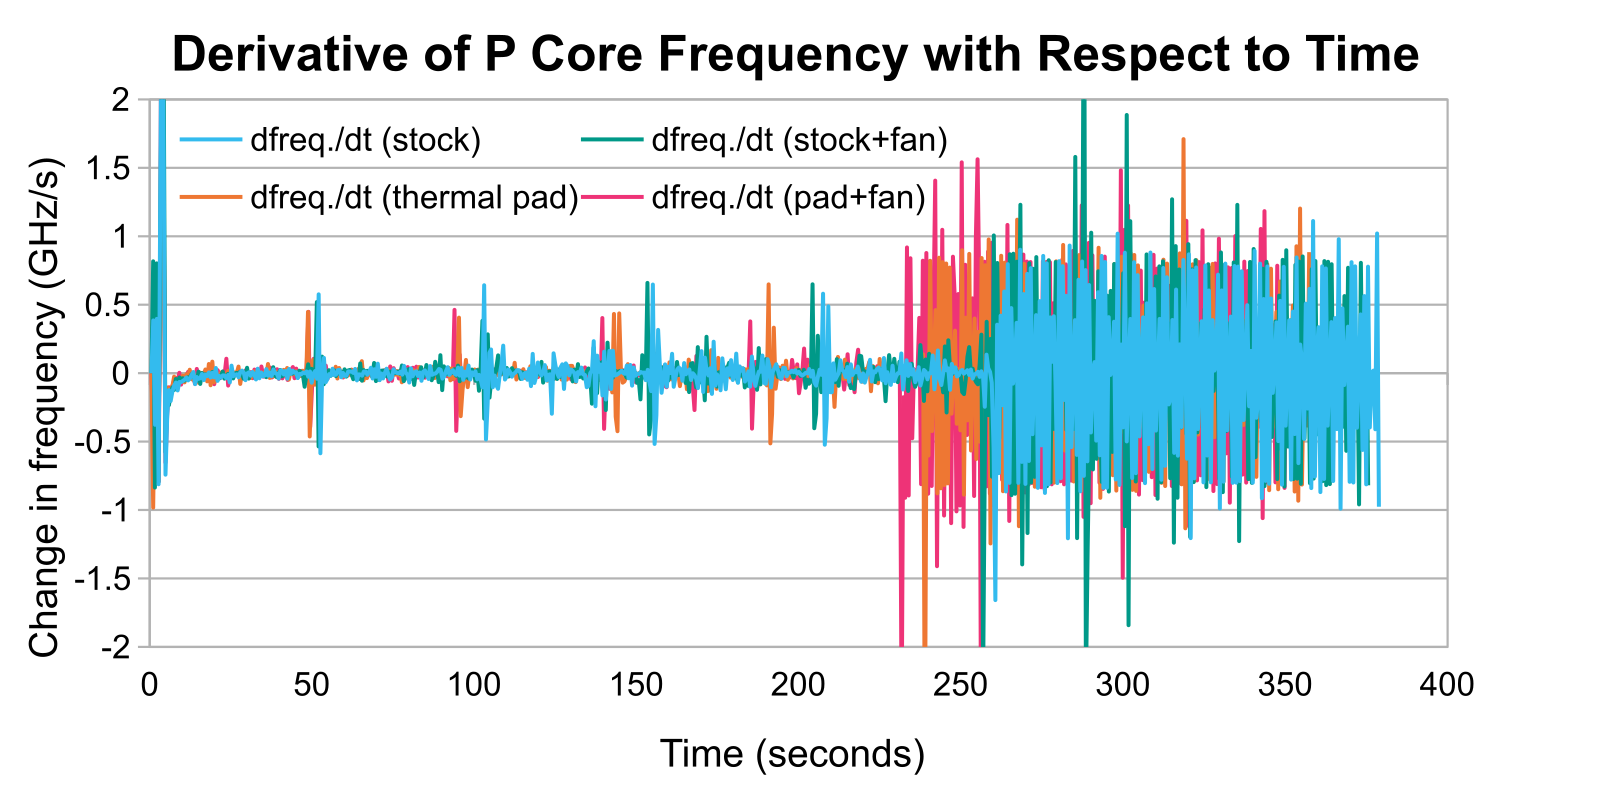
The Macmon timestamps that correspond to these extrema provide FFmpeg runtimes that are quite close to the file metadata method. While I didn't use these for analysis, I do not believe that any trends that I identified or conclusions that I reached would have changed if I had.
Appendix B: P Core versus E Core Performance
I am omitting this section from the body because I have limited confidence in its accuracy. Frustratingly, I was unable to satisfatorily estimate the IPCsInstructions per cycle of the E cores relative to the P cores. The scheduler simply didn't want to cooperate. FFmpeg can be run on an arbitrary number of threads, but the scheduler will always prioritize the P cores. It is possible to force a program to run on the E cores only using the command taskpolicy -b -p $processID, but this also appeared to deprioritize the task in question. When applied to FFmpeg, the E cores averaged around 1.5 GHz, so they were clearly underutilized compared to normal.
Instead, I tried to calculate the performance using data gathered from the benchmarks discussed in the body that were run on all six cores. I created four linear equations of the formIPCE + ((freq.P ÷ freq.E) × IPCP) = total instructions ÷ (freq.E × runtime)
using the runtime and average P core and E core frequencies from the second through fifth runs of each benchmark. The first run was omitted because the P core frequencies only reached a steady state after it concluded. Total instructions—i.e., the aggregate number of calculations needed to transcode the video four times—was unknown and arbitrarily set equal to 1, so the least squares approximations for IPCE and IPCP were in actuality one-quarter the fraction of video transcoded in one billion CPU cycles.
Thankfully, dividing one of these values by the other yields the desired simple unitless ratio. When further dividing by the respective number of each type of core, each E core averaged 27% the IPCs of a P core.
I also took the data used to create Figure 12 and created several linear equations—basically, for two benchmarks Benchmark 1 and Benchmark 2,total cyclesP1 + total cyclesE1 = total cyclesP2 + total cyclesE2
then solve(total cyclesE1 - total cyclesE2) ÷ (total cyclesP2 - total cyclesP1)
Calculating the six equations for the six combinations of benchmarks and taking the mean and standard deviation showed that the E cores achieved 33% ± 13% the IPCs of the P cores, which is consistent with the previous least squares method. But this is a wide range that puts the E cores' IPCs I believe about as high as Skylake's or as low as NetBurst's if we assume the P cores are about twice as performant as Skylake.
I do have benchmark results running FFmpeg on two threads, and they should have only utilized the P cores since the scheduler didn't have a good reason to load up the E cores, but I'm sick of staring at spreadsheets. Any attempts to glean usable data from that are getting kicked down the curb. The idea feels clever—I'm not asking "how fast are the E cores?" but rather "how much slower is the CPU without the E cores?" and using that to estimate E core performance—but I don't feel confident it will yield good results. We shall see. A cursory look at the data shows FFmpeg running about 45% slower, which put the E cores at around 40% the performance of the P cores, which while somewhat higher is still consistent with the previous calculations if only because of the large error bars.
Appendix C: P Core versus E Core Power Consumption
As with Appendix B, I am omitting this section from the body because I only have limited confidence in its accuracy. However, I do think it's worthwhile to include regardless. Macmon only logs a single value for CPU power consumption, lumping the P cores and E cores together, so estimating the share of power consumption that can be attributed to each type of core is difficult. However, as seen in Figure 1, the E cores operated at essentially the same frequency regardless of benchmark condition. Because of this, it's safe to assume that the E cores consumed consistent amounts of power regardless of condition, so any differences in total CPU power consumption could be attributed to the P cores alone.
More precisely, I assumed that the E cores consumed an equal amount of energy per clock cycle to account for minor differences in frequency. The power consumption of a microprocessor scales linearly with frequency and quadratically with voltage. The linear relationship to frequency ought to be intuitive: if the processor needs some amount of energy to undergo one cycle, then doubling the frequency of these cycles also doubles the rate at which it consumes energy, i.e., its power consumption. The quadratic relationship to voltage can be explained by Ohm's law and the equation for the power consumption of a circuit: if V = I × R and P = I × V, then solving for I in the former equation and substituting that into the latter equation yields P = V2 ÷ R where R is a constant quantity. (Bandgap)
The power consumption of the CPU is equal to the sum of the power consumptions of the P cores and E cores. The power consumption of a type of core is equal to the energy used each cycle multiplied by its frequency. This results in the equation (freq.E × (Energy / cycle)E) + (freq.P × (Energy / cycle)P) = PowerCPU. Solving for (Energy / cycle)E yields the equation (Energy / cycle)E = ((-freq.P ÷ freq.E) × (Energy / cycle)P) + (PowerCPU ÷ freq.E). Four equations in this form were created using data from collected during the second through fifth runs of each benchmark; as before, the first runs were omitted due to the more variable P core frequency. Both (Energy / cycle)E and (Energy / cycle)P were unknown, but applying the constraint that (Energy / cycle)E was constant allowed calculating a least squares approximation.
The approximation yielded an energy efficiency of 0.958 joules per billion cycles or 0.958 W / GHz for the four E cores. This value was plugged back into the original linear equations to solve for P core energy efficiency as a function of frequency. The square root of this value for a benchmark was used to determine P core voltage relative to the other benchmarks. Unfortunately, it was not possible to determine the absolute voltage, but this should still show the trend. Charts are shown in Figure 15 and 16.
-
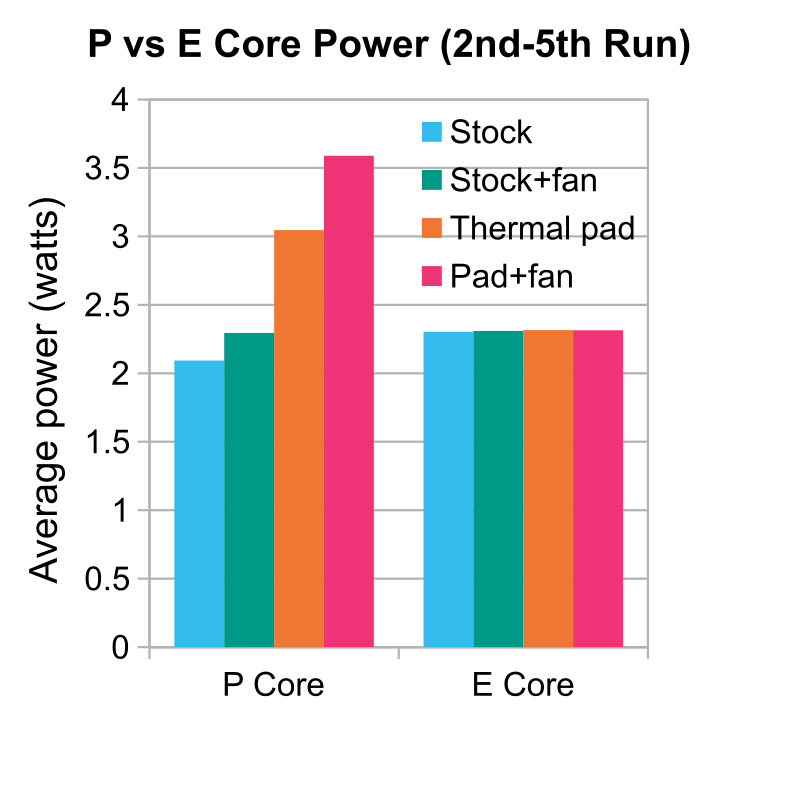
Figure 15. The power consumption of each type of core in the A18 Pro estimated using gathered data. -
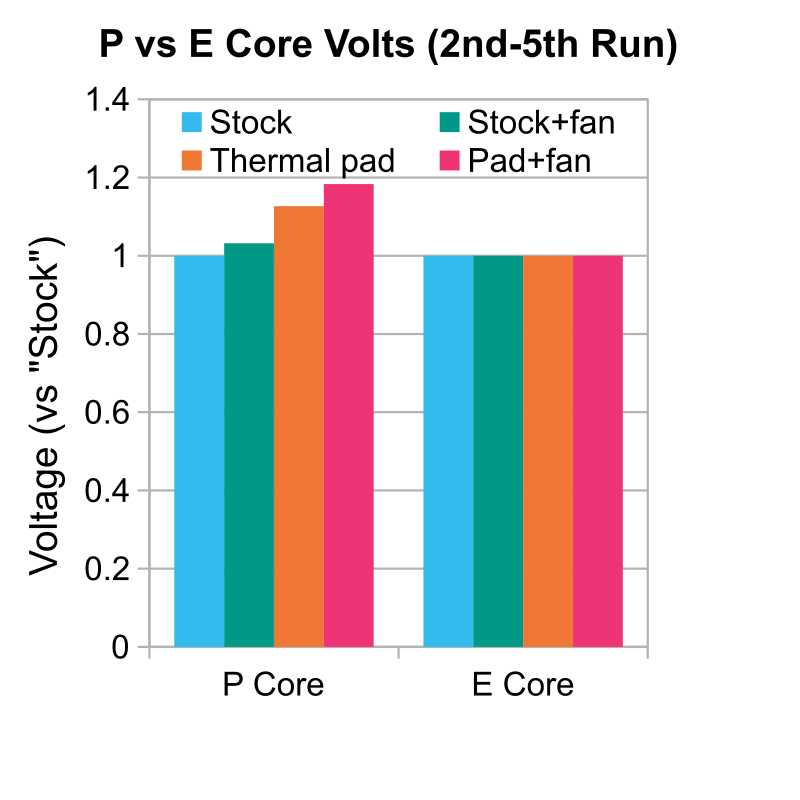
Figure 16. The voltage of each type of core in the A18 Pro estimated using gathered data relative to the respective type of core in the "Stock" condition. Note that the E core voltage is identical for all four conditions due to the constraint of the approximation.
Finally, a voltage-frequency curve for the P cores was constructed using these estimates. This curve along with its equation are shown in Figure 17. A curve for power consumption as a function of frequency is also included.
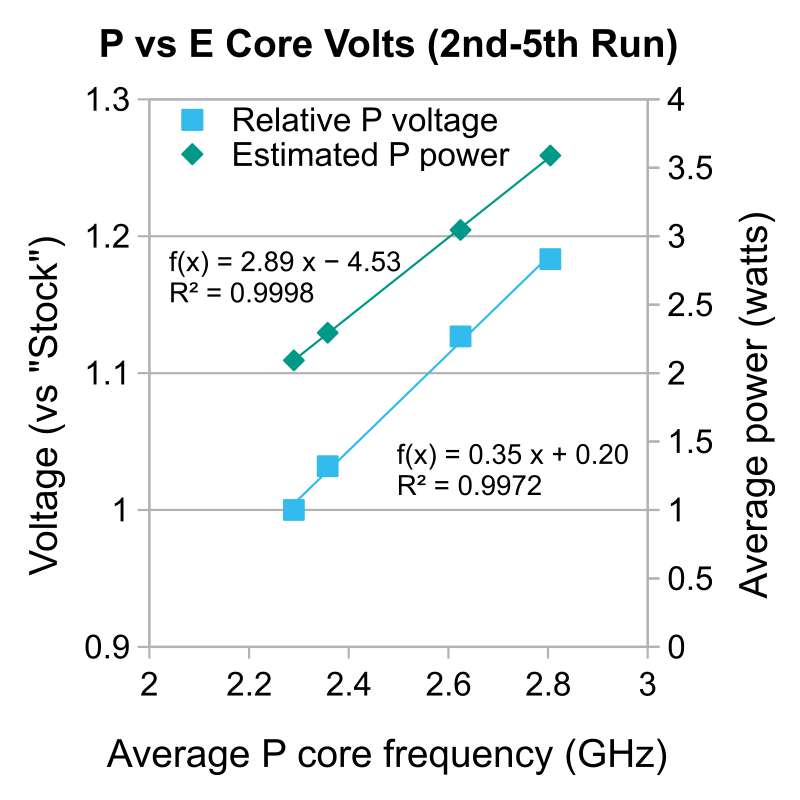
My primary concern with this plot is that the R2 values seem too good. I am not certain if the relationship between frequency and voltage or power consumption is actually this predictable or if it's a consequence of the least squares approximation used. I also do not particularly like that the linear fit for both quantities is this good. While it's not unreasonable for the P core V-f curve to be linear over the range of about 2.2 GHz to 2.8 GHz given that these cores range from a few hundred megahertz idle to 4.51 GHz in an M4 Pro or Max, I do not like that both the voltage and power consumption fit this well linearly, and once again I am not sure if this is merely a consequence of the approximation. There isn't enough data over a wide enough range to determine the best-fit cubic polynomial, however.